Refer to the information provided in Figure 10.2 below to answer the question(s) that follow. 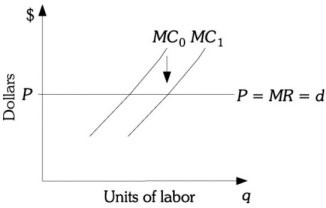 Figure 10.2 Refer to Figure 10.2. This firm?s marginal cost curve has shifted from MC1 to MC0. A likely explanation for this is that
A. the supply of a variable input increased.
B. the demand for the firm?s product increased.
C. the productivity of a variable input increased.
D. the price of a variable input increased.
Answer: D
You might also like to view...
Gross domestic product is the money value of manufacturing production in a year.
Answer the following statement true (T) or false (F)
Letters are used to represent the terms used to answer this question: price (P), quantity of output (Q), total cost (TC) and average total cost (ATC). Which of the following equations is equal to a firm's profit?
A) P - ATC B) (P × Q) - (P × ATC) C) P - TC D) (P × Q) - TC
Price discrimination often permits some consumers who otherwise would be excluded from a market to buy a good or service
a. True b. False Indicate whether the statement is true or false
In the following graph, the price of capital is $100 per unit. If a firm decides that total cost must not exceed $3,500, what is the maximum amount of output it can produce?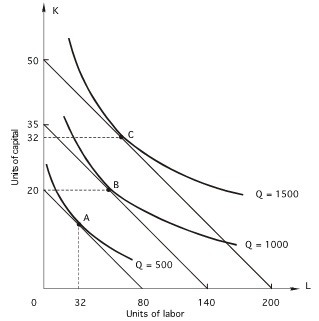
A. 1,000 B. 1,500 C. 500 D. 100 E. none of the above