Graph the inequality on the number line.x < -4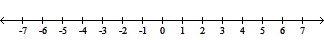
A. ![]()
B. ![]()
C. ![]()
D. ![]()
Answer: B
Mathematics
You might also like to view...
Solve.The population of a town was about 40,000 in 1910. In 1935, the population was about 81,000. Assuming the exponential model, what was the growth rate of the town, to the nearest hundredth of a percent, during this period?
A. 28.22 % per year B. 1.57 % per year C. 3.54 % per year D. 2.82 % per year
Mathematics
Simplify the expression. Use positive exponents. Assume variables represent nonnegative numbers.(8a)(5a2)
A. 40a3 B. 40a4 C. 13a3 D. 8a + 5a2
Mathematics
Choose the expression which is equivalent to the given expression.
A. cot 5° B. cos 5° C. sin 5° D. tan 5°
Mathematics
Without graphing the function, determine its amplitude or period as requested.y = cos 3xFind the period.
A. 3
B. 1
C. 2?
D. 
Mathematics