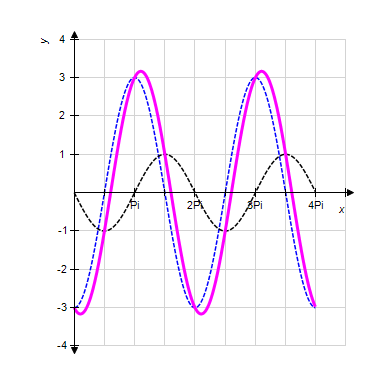
Use your graphing calculator to graph the function between  and
and  . Show the graph of
  ,
,
alt="" class="wirisformula" data-wiris-created="true" src="https://sciemce.com/media/3/ppg__cognero__Section_4.6_Graphing_Combinations_of_Functions__media__a0e5a84c-7756-4580-9511-115066d9930e.PNG" style="vertical-align:middle;" />, and  . (Make sure your calculator is set to radian mode.)
?

?
A. ?
B. ??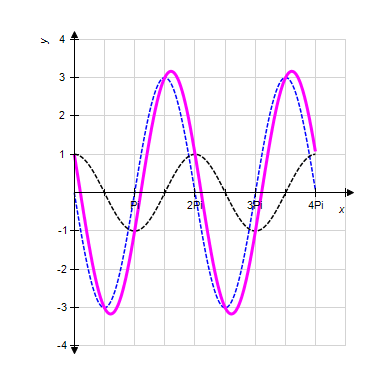
C. ?
D. ?
Answer: C
Mathematics
alt="" class="wirisformula" data-wiris-created="true" src="https://sciemce.com/media/3/ppg__cognero__Section_4.6_Graphing_Combinations_of_Functions__media__a0e5a84c-7756-4580-9511-115066d9930e.PNG" style="vertical-align:middle;" />, and . (Make sure your calculator is set to radian mode.)
?
?
A. ?
B. ?
?
C. ?
D. ?
Answer: C
You might also like to view...
Use the graph of the function f(x) to locate the local extrema and identify the intervals where the function is concave up and concave down.
A. Local minimum at x = 1; local maximum at x =-1; concave down on (0, ?); concave up on (-?, 0) B. Local minimum at x = 1; local maximum at x =-1; concave up on (0, ?); concave down on (-?, 0) C. Local maximum at x = 1; local minimum at x =-1; concave up on (-?, ?) D. Local maximum at x = 1; local minimum at x =-1; concave up on (0, ?); concave down on (-?, 0)
Find the surface area of the surface S.S is the portion of the surface 12x + 5z = 3 that lies above the rectangle 1 ? x ? 3 and  in the
A. 
B. 
C. 
D. 104
Perform the indicated operation. Give answers in rectangular form expressing real and imaginary parts to four decimal places. 2
2
A. 4.3412 + 24.6202i B. 8.5505 - 23.4923i C. -23.4923 + 8.5505i D. -4.6985 + 1.7101i
Evaluate the expression for the given replacement values.2x + y for x = 8 and y = -9
A. 25 B. -1 C. 7 D. 17