The following data, compiled by the admissions office at Faber College during the past 5 years, relate the number of college brochures and follow-up letters (x) sent to a preselected list of high school juniors who had taken the PSAT and the number of completed applications (y) received from these students (both measured in units of 1,000).
x44.555.56y0.50.60.80.91.2?
Determine the equation of the least-squares line for these data. Use the result obtained to predict the number of completed applications that might be expected if 6,800 brochures and follow-up letters are sent out during the next year.
?
A.  ; 1,412 applications
B.  ; 1,364 applications
C.  ; 1,387 applications
D.  ; 1,378 applications
Answer: A
Mathematics
You might also like to view...
The graph of a function is given. Determine whether the function is increasing, decreasing, or constant on the given interval.(-3, 0)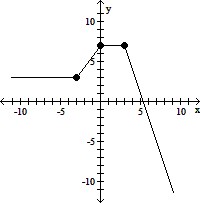
A. decreasing B. constant C. increasing
Mathematics
Simplify the expression.
?
 ?
Write your answer without using negative exponents.
?
Write your answer without using negative exponents.
What will be an ideal response?
Mathematics
Perform the indicated operation and simplify. Write the answer in the form a + bi.(4 - 9i)2
A. 97 - 72i B. 16 - 153i C. -65 - 72i D. 16 + 9i
Mathematics
Solve for x.|12 - 3x| ? 15
A. -9 ? x ? 1 B. x ? - 1 or x ? 9 C. x ? -9 or x ? 1 D. - 1 ? x ? 9
Mathematics