What is the difference between tax cuts imposed on higher-income households compared with lower- and middle-income households? Discuss the implications for the multiplier and the effectiveness of the tax cuts for boosting GDP.
What will be an ideal response?
Higher-income households tend to save a higher fraction of their incomes than lower- and middle-income households. That is, high-income households have a lower MPC. This means that they have a lower multiplier. When the government reduces taxes for all Americans, high-income households save a higher portion of their tax cut than do low- and middle-income households.For a tax cut to affect GDP, households have to spend the tax cut on goods and services. If households save most of the tax cut, then GDP will not increase by as much. However, if the tax cut were targeted toward households that spend most of their income, the effects on GDP would be larger.
You might also like to view...
During economic fluctuations, individual markets usually move in different directions
a. True b. False Indicate whether the statement is true or false
The "cost disease of personal services" phenomenon predicts that the price of tickets to baseball games and cell phone rates will increase at approximately the same rate
a. True b. False Indicate whether the statement is true or false
Refer to the above figure. The government has just engaged in expansionary fiscal policy shifting the aggregate demand curve from AD 1 to AD 2 . Interest rates have started to rise. Which of the following statements is true in the short run?
A) Real GDP will be $14 trillion since the effect of government spending is not influenced by interest rates. B) Real GDP will fall back to $11 trillion since the effect that increased government spending has on real GDP is short lived. C) Real GDP will go beyond $14 trillion as businesses and consumers react to the increase in interest rates. D) Real GDP will end up somewhere between $11 and $14 trillion as businesses and consumers reduce their spending in response to the increase in interest rates.
Refer to the information provided in Figure 4.6 below to answer the question(s) that follow.Equilibrium in this market occurs at the intersection of curves S and D.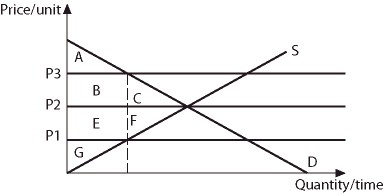 Figure 4.6Refer to Figure 4.6. Consumer surplus is area [A + B + E] if price is
A. P1. B. P2. C. P3. D. above P3.