Empirical evidence suggests that the relative scarcity of most resources is
a. declining.
b. increasing slowly.
c. increasing rapidly.
d. largely unchanged over the past four decades.
A
You might also like to view...
For a good that is taxed, the area on the relevant supply-and-demand graph that represents government's tax revenue is
a. smaller than the area that represents the loss of consumer surplus and producer surplus caused by the tax. b. bounded by the supply curve, the demand curve, the effective price paid by buyers, and the effective price received by sellers. c. a right triangle. d. a triangle, but not necessarily a right triangle.
Government assistance to the poor in the United States
A. has eliminated poverty in the nation. B. is available to all persons whose income is below the poverty income threshold. C. is available in most cases only to the poor who are elderly, disabled, or families with children. D. is always in the form of cash.
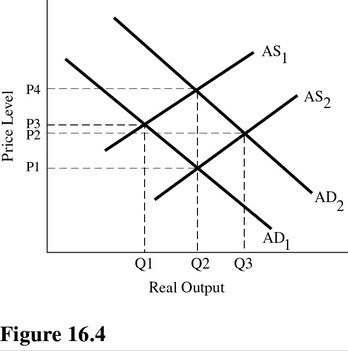 Refer to Figure 16.4. If the economy is initially in equilibrium at P3 and Q1, which of the following policies would move the economy to equilibrium at P2 and Q3?
A. Restrictive supply-side policy alone. B. A combination of restrictive fiscal policy and restrictive monetary policy. C. A combination of expansionary monetary policy and expansionary supply-side policy. D. Contractionary monetary policy alone.
The total labor force is 100,000 out of a possible working age population of 160,000. The total number of unemployed is 8,000. What is the unemployment rate?
A. 7 percent B. 6 percent C. 5 percent D. 8 percent