Refer to the double-bar graph below which shows the number of male (M) and female (F) athletes at a university over a four-year period. Solve the problem. 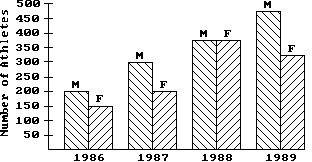 YEARWhich year had the greatest number of male athletes?
A. 1989
B. 1987
C. 1988
D. 1986
Answer: A
You might also like to view...
Match the situation to the graph that models it best.The amount of money y spent on x items having the same cost
A. 
B. 
C. 
D. 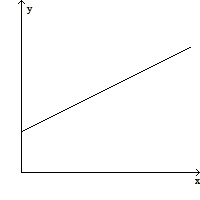
Use the result ei? = cos ? + i sin ? to plot the complex number.-3e(?i)/2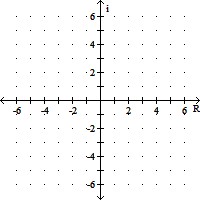
A. 
B. 
C. 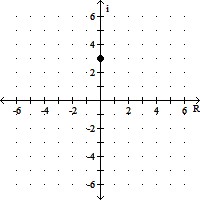
D. 
Which of the following figures is mapped onto itself by a 90 deg rotation around the point of intersection of its diagonals?
(a) a rhombus. (b) a rectangle. (c) A parallelogram. (d) A pentagon. (e) None of these is correct.
Answer the question.How can the graph of f(x) = 0.2(x + 1)2 - 12 be obtained from the graph of y = x2?
A. Shift it horizontally 1 units to the left. Shrink it horizontally by a factor of 0.2. Shift it 12 units down. B. Shift it horizontally 1 units to the left. Shrink it vertically by a factor of 0.2. Shift it 12 units down. C. Shift it horizontally 12 units to the left. Stretch it vertically by a factor of 4. Shift it 1 units down. D. Shift it horizontally 1 units to the right. Shrink it vertically by a factor of 0.2. Shift it 12 units up.