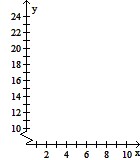
Solve the problem.For the following table of data, a.Draw a scatterplot.b.Calculate the correlation coefficient.c.Calculate the least squares line and graph it on the scatterplot.d.Predict the y-value when x is 25.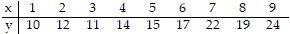
 ?
?
A. a.
b. 0.950
c. Y = 1.7x + 8.5
d. 51
B. a.
b. 0.903
c. Y = 2x + 6.5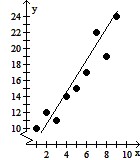
d. 56.5
C. a.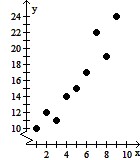
b. 0.950
c. Y = 1.7x
d. 42.5
D. a.
b. 0.950
c. Y = 1.7x + 7.5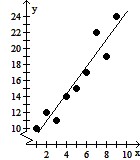
d. 50
Answer: D
You might also like to view...
State whether you think the difference between what occurred and what you would expect by chance is statistically significant.Of the people taking the medication, 38 out of 100 noticed improvement in their arthritis. Of the people taking the placebo, 35 out of 100 noticed improvement in their arthritis.
A. Not statistically significant B. Statistically significant
Simplify.
A. 
B. 
C. 
D. 
Complete the ordered pairs. Then graph the equation by plotting the points and drawing a line through them.y = -x - 7(0, ), ( , 0), (1, )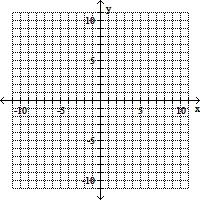
A. (0, 7), (7, 0), (1, 6)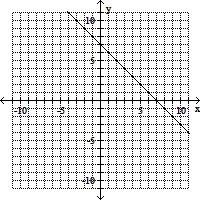
B. (0, -7), (7, 0), (1, -6)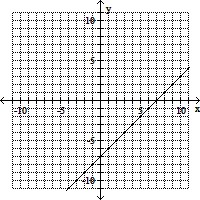
C. (0, 7), (-7, 0), (1, 8)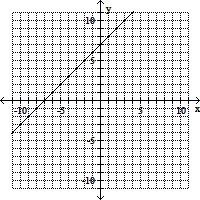
D. (0, -7), (-7, 0), (1, -8)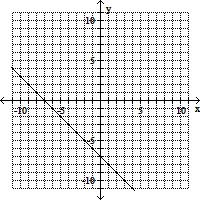
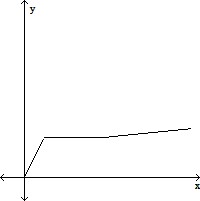
Match the function with the graph that best describes the situation.The amount of rainfall as a function of time, if the rain fell more and more softly.
A. 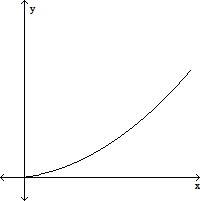
B. 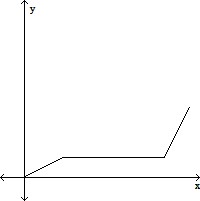
C. 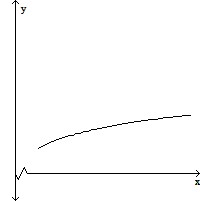
D.