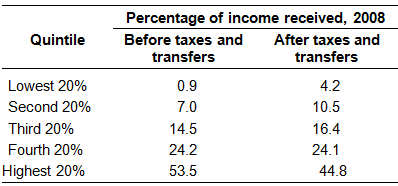
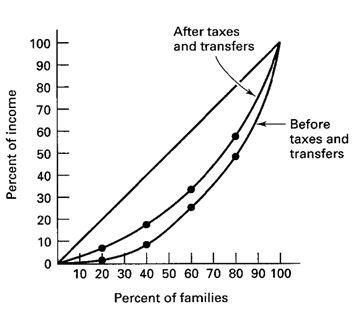
The following table shows the percentage of income received by quintile. In the graph below, draw a Lorenz curve using the before taxes and transfer data and a Lorenz curve for the after taxes and transfer data. Label the Lorenz curves and each axis of
the graph.
You might also like to view...
The used car market has a significant amount of adverse selection because
A) the seller knows more about the car than the buyer. B) the buyer can easily find out more about the car than the seller. C) buyers and sellers rarely have enough information. D) the transaction costs of the used car market are prohibitive.
Cooperation:
B. is sustained by the promise of punishment for good behavior. C. can be established even if threats/promises are not credible. D. All of these are true about cooperation.
Figure 10-9 shows the demand and cost curves for a monopolist. Refer to Figure 10-9. What is the economically efficient output level?
Suppose that a subsidy is provided for the consumption of good ABC, and the subsidy is different for different units of good ABC (e.g., $10 subsidy on the first unit of good ABC and $7 on the second unit of good ABC, etc.). The demand curve with such a subsidy will lie to the ______________ of the demand curve without a subsidy, __________ parallel to the demand curve without any subsidy.
A. left; but will not be B. left; and will be C. right; and will be D. right; but will not be