where dist(i, j) is the physical distance between two sensors.
Temperature sensors are deployed in a geographical area, as shown in Figure 2.2 of this
solution manual, where the circles represent sensors. Each small square box is equivalent to
100 square miles. Construct a graph by connecting two sensors
i and j with weights according to the formula
![]()
Each sensor node of Figure 2.2 has given an identity as shown in Figure 2.3
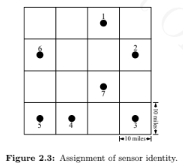
To construct a weighted graph where sensors are vertices and their connectivities are mimicked
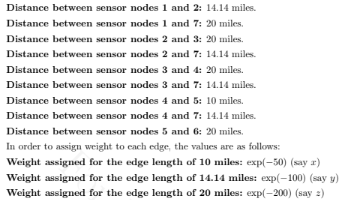
as edges, we need to measure the Euclidean distances among nodes. Note that as the weight
of an edge is 0 if the distance between two sensor nodes are more than or equal to 22 miles, we show distance estimations only between those sensor nodes where creating positive weighted links are possible.
You might also like to view...
The implementation of ArrayQueue.clear() is simple to write and test, but it is inefficient because of the method calls to dequeue(). Provide an alternative implementation that clears the array directly. Perform timing measurements to see what the improvement in speed is.
What will be an ideal response?
Nontraditional data such as audio clips, video clips, pictures, and very large documents are called ________ data
A) enterprise B) multidimensional C) structured D) unstructured
Which of the following statements about identifiers is false?
A. Identifiers must start with a letter or underscore B. Identifiers may not use spaces and hyphens as part of the identifier C. Identifiers symbolically represent data locations D. Good programming style uses an underscore as the first character of an identifier E. Good identifier names are descriptive but short
Use the ____ buttons in the 3D Extrude & Bevel Options dialog box to make extruded objects appear hollow or solid.
A. Feature B. Cap C. Degree D. Display