Refer to the graph below. Suppose that its shows the S and D graphs in a market where production entails a significant amount of pollution. In this case, the government should use its coercive power to make:
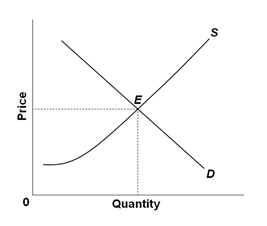
A. The supply curve shift to the left
B. The supply curve shift to the right
C. The demand curve shift to the left
D. The demand curve shift to the right
A. The supply curve shift to the left
You might also like to view...
The figure above shows a natural monopoly that the government must regulate. If the government uses ________, the firm produces ________ units per week
A) the HHI; 50 B) an average cost pricing rule; 30 C) rate of return regulation; 40 D) social interest regulation; 30 E) a marginal cost pricing rule; 20
The firm's production function is the relationship between the ________ and ________
A) output produced; the quantities of all inputs B) maximum output attainable; the quantity of variable inputs C) possible range of maximum output; the quantity of variable inputs D) maximum output attainable; the quantities of both labor and capital
If a U.S. dollar purchases 4 Argentinean pesos, and a gallon of milk costs $3 in the U.S. and 6 pesos in Argentina what is the real exchange rate?
a. 2 b. 3/2 c. 2/3 d. 1/2
Why is the perfect competition model unrealistic?
A. The model assumes that market structures are dynamic. B. Monopoly is more prevalent in the economy than is perfect competition. C. Homogeneous products are numerous in the economy. D. Self-seeking individuals actively seek out ways to limit competition to increase personal gains.