Evaluate the definite integral and interpret the result.
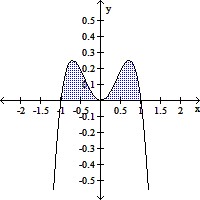
A.  ; the area bounded by the x-axis and the graph of y = x2 - x4 is
  .
.
B. -  ; the area bounded by the x-axis and the graph of y = x2 - x4 is -
  .
.
C.  ; the area bounded by the x-axis and the graph of y = x2 - x4 is
  .
.
D. -  ; the area bounded by the x-axis and the graph of y = x2 - x4 is -
  .
.
Answer: A
You might also like to view...
Find the Taylor series generated by f at x = a.f(x) =  , a = 3
A. 
B. 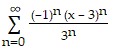
C. 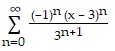
D. 
The graph and equation of a polynomial f(x) are given. Determine the number of real zeros and the number of imaginary zeros.f(x) = x3 - 9x2 + 27x - 25
A. One real zero; no imaginary zeros B. Three real zeros; no imaginary zeros C. One real zero; one imaginary zero D. One real zero; two imaginary zeros
Solve the problem.The sum of the reciprocals of two consecutive integers is  . Find the integers.
A. 5 and 6 B. 11 and 12 C. 6 and 7 D. 4 and 5
Solve the problem.From April through December 2000, the stock price of QRS Company had a roller coaster ride. The chart below indicates the price of the stock at the beginning of each month during that period. The average rate of change in price between April and December is -$6.00 per month. Interpret this average rate of change. 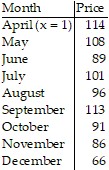
A. Between April and December, the price of the stock increases at a rate of $6.00 per month. B. Between April and December, the price of the stock decreases at a rate of $6.00 per day. C. In each month between April and December, the price of the stock decreased by $6.00. D. Between April and December, the price of the stock decreases at a rate of $6.00 per month.