Refer to the supply and demand graph below. In the graph, line S is the current supply of this product, while line S1 is the optimal supply from the society's perspective. If government corrects this externality problem and shifts production to the
socially optimal level, then the product price will be equal to:
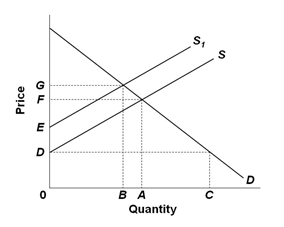
A. 0G
B. 0F
C. 0E
D. 0D
A. 0G
You might also like to view...
The rate of unemployment when the economy is fully employed is called the
A. full-employment rate of unemployment. B. natural rate of unemployment. C. frictional rate of unemployment. D. structural rate of unemployment.
Explain how each of the following events would affect the long-run aggregate supply curve
a. A lower price level b. A decrease in the labor force c. A decrease in the quantity of capital goods d. Technological change
Exhibit 17-1 Inflation and unemployment rates In Exhibit 17-1, when the unemployment rate goes from 3 percent to 9 percent,
A. the level of inflation is unaffected. B. the inflation rate goes from 8 percent to 14 percent. C. the inflation rate goes from 8 percent to 3 percent. D. the inflation rate goes to 0 percent.
What are the advantages and disadvantages to the value-added tax (VAT)?
What will be an ideal response?