The following double-bar graph illustrates the revenue for a company for the four quarters of the year for two different years. Use the graph to answer the question. 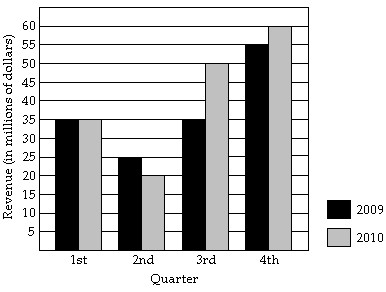 How much more revenue was generated from 2009 to 2010 in the fourth quarter?
A. $10,000,000
B. $15,000,000
C. $1,000,000
D. $5,000,000
Answer: D
You might also like to view...
Match the system with the correct graph.x + y = 9x - y = -3
A. 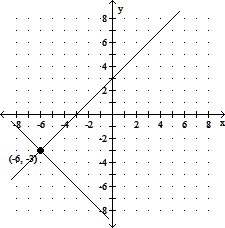
B. 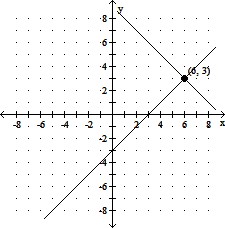
C. 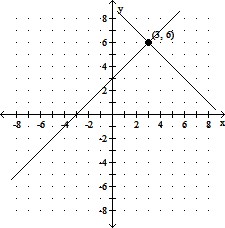
D. 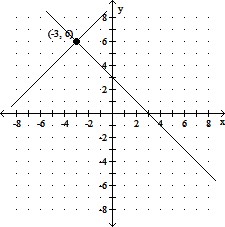
Write the expression in exponential notation.4 ? 4 ? 4
A. 3 ? 4 B. 41 C. 34 D. 43
Use Bayes' rule to find the indicated probability.Two shipments of components were received by a factory and stored in two separate bins. Shipment I has 2% of its contents defective, while shipment II has 5% of its contents defective. If it is equally likely an employee will go to either bin and select a component randomly, what is the probability that a defective component came from shipment II?
A. 0.714 B. 0.222 C. 0.5 D. 0.2
Find the relative extrema of the function, if they exist.f(x) = 
A. No relative extrema exist B. Relative maximum at (-2, 2) C. Relative minimum at (-2, 2); relative maximum at (2, -2) D. Relative minimum at (-2, 2)