?
?
?
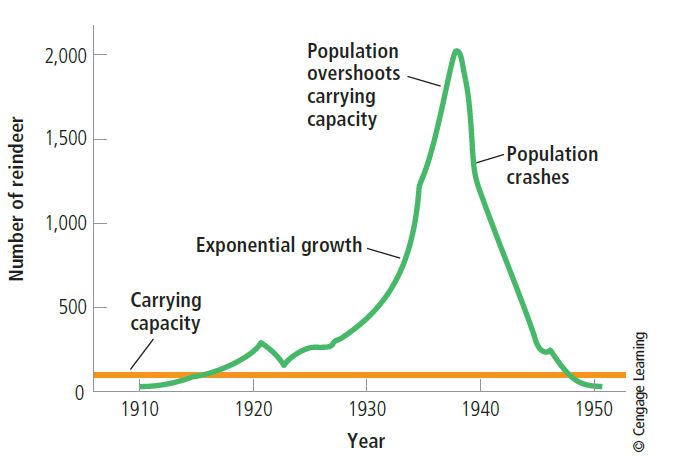
?Figure 5.17
?
Use the figure above to answer the following questions.
?
What happens to a population if a dieback occurs, and which portion of the graph represents this?
What will be an ideal response?
A population suffers a sharp decline, also called a population crash. It is represented by letter C.
You might also like to view...
The growth of cities in the nineteenth century was most closely linked with the
A) increased power of states. B) increased size of states. C) increased importance of industrialization. D) decreased output of agriculture in rural areas. E) increased amount of social services available in cities.
At the checkout counter, an environmentalist is most likely to say
a. "Plastic please" b. "Paper please" c. "I brought my own bag." d. "I want a cardboard box, please." e. "Either plastic or paper."
Which one of the following statements is true concerning natural levees?
a.) depositional features formed at times of low discharge b.) erosional features left behind when meander cutoff occurs c.) form the high, steep banks of a downcutting stream d.) mostly fine sand and silt that build up during floods
Generally, higher education and better health care systems lead to lower crude death rates
Indicate whether the statement is true or false.