Figure 4-8
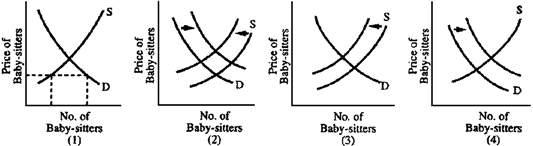
Women today are having more babies than women did fifteen years ago. The result is that mothers today have trouble finding baby-sitters and are shocked at what they must pay for child care. Which graph in Figure 4-8 best illustrates how the situation has changed?
a.
1
b.
2
c.
3
d.
4
d
You might also like to view...
A price cap regulation ________
A) is illegal B) is a price floor C) is a price ceiling D) encourages a firm to operate inefficiently
Refer to Scenario 17.1. If the threshold educational level y* is set at 10,
A) only individuals in Group A will attain it. B) only individuals in Group B will attain it. C) individuals in both groups will attain it. D) no individuals will attain it. E) some fraction of individuals in each group will attain it.
Suppose the market demand function in a certain market where Q is measured in thousands of units is Qd = 20 - 2.5P, and the market supply function is Qs = 2.5P - 7.5. How much deadweight loss would there be in this market if the quantity bought and sold was 8,500 units?
A. $2.03 B. $4.05 C. $1,800 D. $2,025
When an economy's simple spending multiplier is 2.5, then its marginal propensity to consume is 0.4
a. True b. False Indicate whether the statement is true or false