Solve the problem.The function f models the population of Country X from 1991 to 1998. The graphs of f and the horizontal line y = 115 are shown in the figure. Use the graphs to determine the x-values that satisfy (i) the inequality  and (ii)
  Express your answers symbolically.
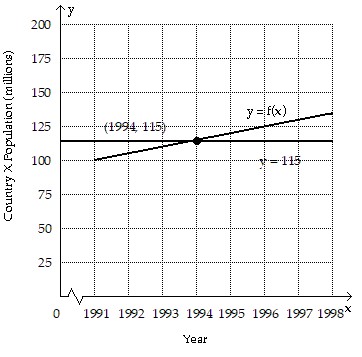
A. {x|x > 1994}; {x|x ? 1994}
B. {x|x = 1994}; {x|x ? 1994}
C. {x|x ? 1994}; {x|x > 1994}
D. {x|x = 1994}; {x|x > 1994}
Answer: A
Mathematics
You might also like to view...
Use the exponential key to find an approximation to the nearest thousandth.142.8
A. 39.2 B. 1,820,591.2 C. 1618.671 D. 196
Mathematics
Solve.Find the unknown length given that the area is 198 cm2.
A. 32 cm
B. 6 cm
C. 16 cm
cm
D. 16 cm
Mathematics
Write a word name for the number in the sentence.The weight of a full grown Great Pyrenees dog named Simba is 152.86 pounds.
A. One hundred fifty-two and eighty-six hundredths B. One hundred fifty-two and eighty-six thousandths C. One hundred fifty and two hundred eighty-six thousandths D. One thousand fifty-two and eighty-six tenths
Mathematics
Solve.4n - 3 = 33
A. n = 11 B. n = 36 C. n = 32 D. n = 9
Mathematics