Refer to Figure 5.5. Which diagram shows the income-consumption curve resulting from a decrease in income?
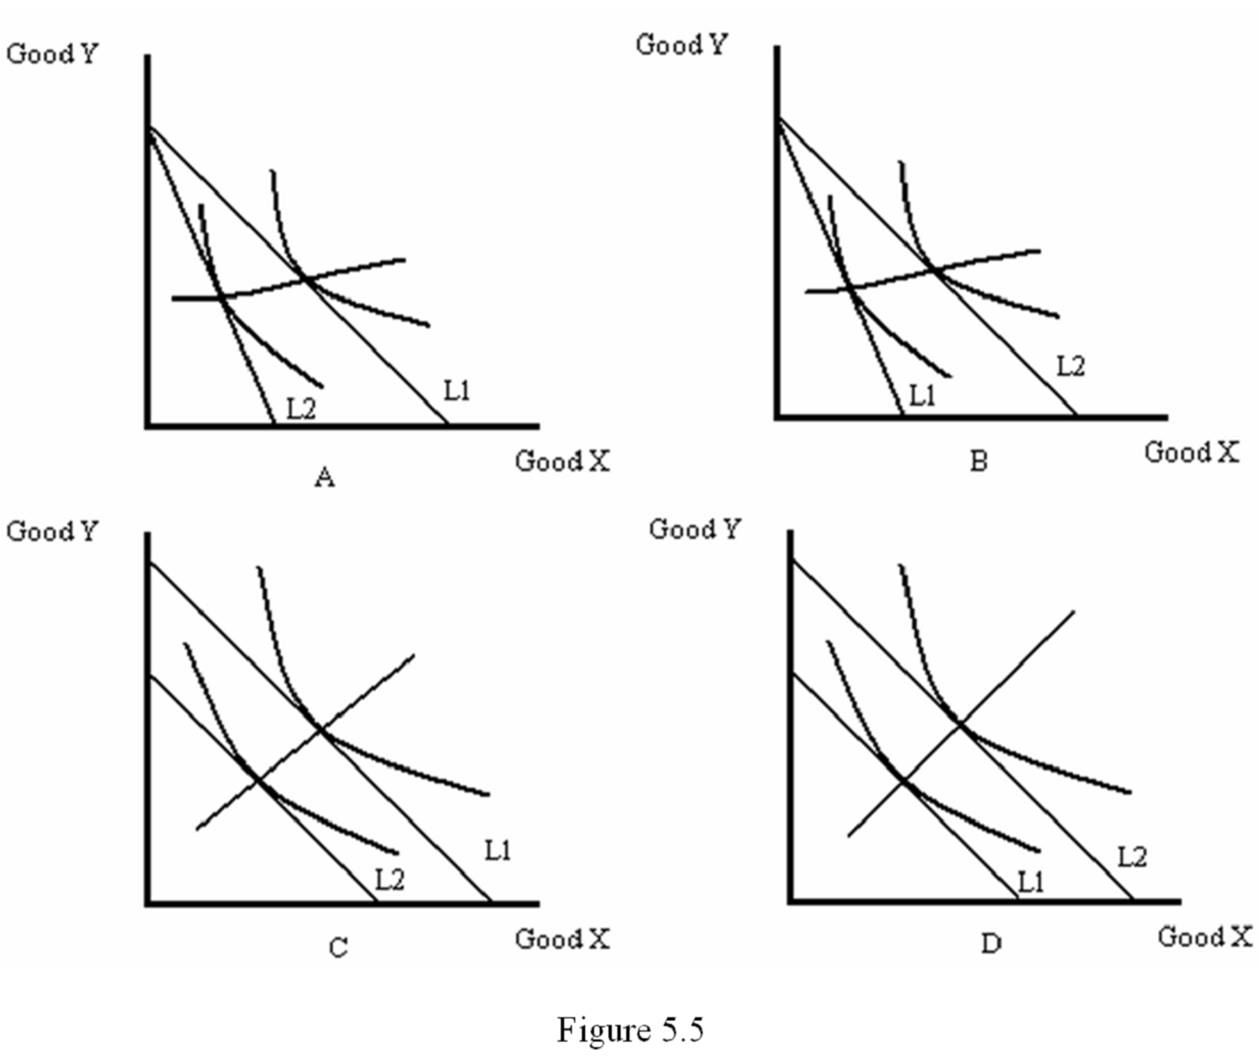
A. A
B. B
C. C
D. D
C. C
You might also like to view...
If taxes are cut, there is
A) an increase in aggregate demand and the AD curve shifts rightward. B) a decrease in aggregate demand and the AD curve shifts leftward. C) an increase in the quantity of real GDP demanded and a movement up along the AD curve. D) a decrease in the quantity of real GDP demanded and a movement down along the AD curve. E) no change in aggregate demand, only a change in potential GDP.
An economic variable that moves in the same direction as aggregate economic activity (up in expansions, down in contractions) is called
A) procyclical. B) countercyclical. C) acyclical. D) a leading variable.
Exhibit 2-11 Production possibilities curves In Exhibit 2-11, which of the following could have caused the production possibilities curve of an economy to shift from the one labeled A to the one labeled B?
A. A major natural disaster B. An increase in consumption goods production this year C. An advance in technology D. An increase in unemployment
Buyers and sellers in a factor market might be negotiating an exchange of
A. services provided to final consumers. B. either goods for use by final consumers or services provided to final consumers. C. goods for use by final consumers. D. labor or financial capital.