Write the equation of the graph in its final position.The graph of y = 8ex is translated 6 units to the right, reflected in the y-axis, and then translated 3 units downward.
A. y = e-x + 6 - 3
B. y = e-x - 6 - 3
C. y = ex - 6 + 3
D. y = ex + 6 + 3
Answer: A
You might also like to view...
Given the term, idenitfy the coefficient, the variable, and the exponent of the variable.15x
A. coefficient: x variable: 15 exponent: 1 B. coefficient: 15 variable: x exponent: 1 C. coefficient: x variable: 15 exponent: 0 D. coefficient: 15 variable: x exponent: 0
Solve the equation and check your solution.-7x = 42
A. x = 1 B. x = -6 C. x = 49 D. x = -49
Solve the problem.The rates of death (in number of deaths per 100,000 population) for 20-24 year olds in the United States between 1985-1993 are given below. (Source: NCHS Data Warehouse) 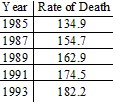 A logarithmic equation that models this data is y = 57.76 + 48.56 ln x where x represents the number of years since 1980 and y represents the rate of death in that year. Use this equation to predict the year in which the rate of death for 20-24 year olds first exceeds 200.
Fill in the blank(s) with the appropriate word(s).
Graph the ellipse. Label the intercepts.4x2 + 9y2 = 36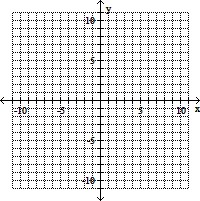
A. (-2, 0), (2, 0), (0, -3), (0, 3)
B. (-2, 0), (2, 0), (0, -3), (0, 3)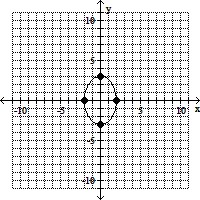
C. (-3, 0), (3, 0), (0, -2), (0, 2)
D. (-3, 0), (3, 0), (0, -2), (0, 2)