Figure 7-4
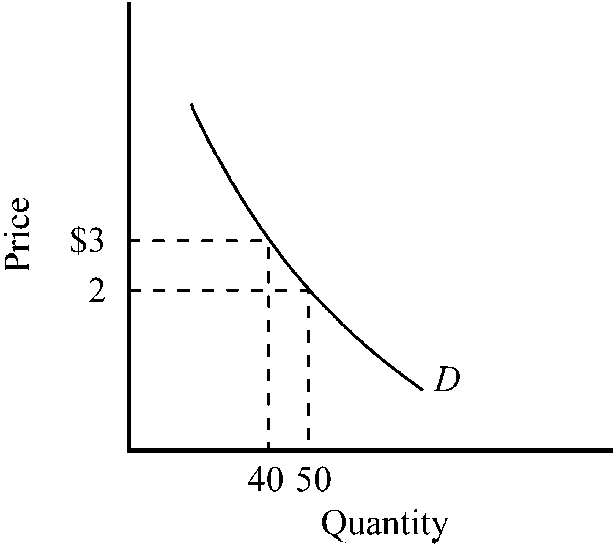
Which of the following is true for the demand curve depicted in ?
a.
An increase in price from $2 to $3 will reduce total expenditures on the product.
b.
In the $2 to $3 range, the price elasticity of the demand curve is approximately unitary.
c.
At a price of $2, the price elasticity of the demand curve equals approximately -2.5.
d.
In the $2 to $3 range, the demand curve is inelastic.
d
You might also like to view...
A change in the price of a good has no effect on the supply schedule.
Answer the following statement true (T) or false (F)
If we included intermediate goods in the calculation of GDP,
a. we would be underestimating GDP b. we would be accurately measuring GDP c. we would be overestimating GDP d. any measurement problems would be offset by including the sale of new goods e. any measurement problems would be offset by including the final goods as well
A country recently had a trade deficit of $2.5 trillion and purchased $3 trillion of foreign assets. How many of its assets did foreigners purchase?
Eliza consumes 12 cappuccinos and 8 apple turnovers per week. The price of a cappuccino is $4 each and apple turnovers are $1 each
a. What is the amount of income allocated to cappuccino and apple turnover consumption? b. What is the price ratio (the price of cappuccinos relative to the price of apple turnovers)? c. Explain the meaning of the price ratio you computed. d. If Eliza maximize utility, what is the ratio of the marginal utility of cappuccinos to the marginal utility of apple turnovers? e. If the price of apple turnovers falls, will Eliza consume more apple turnovers, fewer apple turnovers, or the same amount of apple turnovers? Explain your answer using the rule of equal marginal utility per dollar. What will be an ideal response?