Figure 19-1
?

Of the graphs in Figure 19-1, which one shows the effects of an economic boom in the United States and a depreciation of the dollar?
A. 1
B. 2
C. 3
D. 4
Answer: B
You might also like to view...
A possible sequence for the three stages of a financial crisis might be ________ leads to ________ leads to ________
A) asset price declines; banking crises; unanticipated decline in price level B) unanticipated decline in price level; banking crises; increase in interest rates C) banking crises; increase in interest rates; unanticipated decline in price level D) banking crises; increase in uncertainty; increase in interest rates
The "dual mandate" refers to the:
A. orders given to both the Federal Reserve and the Treasury department to ensure price stability. B. role that the Fed has by being a governmental agency but also must act in the best interest of all citizens of the United States. C. twin responsibilities of the Federal Reserve, to use monetary policy to ensure price stability and maintain full employment. D. responsibility given to the Federal Reserve and the Congress to conduct monetary and fiscal policy respectively, to ensure price stability.
If the money wage and other resource prices do not change when the price level rises by 10%...
What will be an ideal response?
Refer to the information provided in Figure 13.9 below to answer the question(s) that follow. 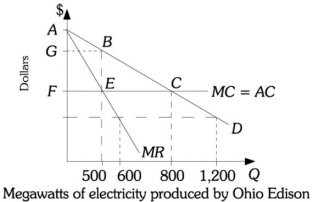 Figure 13.9 Refer to Figure 13.9. If Ohio Edison is forced to act as a perfect competitor (instead of the monopoly level), ________ is BEC.
A. consumer surplus B. producer surplus C. the net social gain D. the welfare loss