Sketch the graph of a function y = f(x) that satisfies the given conditions.f(0) = 0, f(1) = 4, f(-1) = 4,  f(x) = -4.
What will be an ideal response?
Answers may vary. One possible answer: 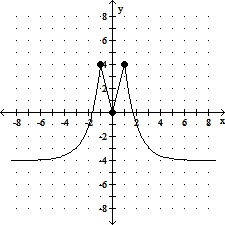
You might also like to view...
The following double-bar graph illustrates the revenue for a company for the four quarters of the year for two different years. Use the graph to answer the question. 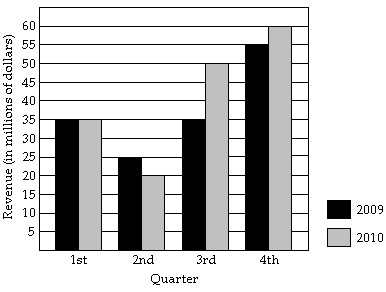 What was the revenue for the fourth quarter of 2009?
A. $55,000 B. $35,000,000 C. $55,000,000 D. $60,000,000
Tell whether the expression is a monomial. If it is, name the variable(s) and coefficient, and give the degree of the monomial.6x3 - 5
A. Monomial; variable x; coefficient 3; degree 2 B. Monomial; variable x; coefficient 3; degree 1 C. Monomial; variable x; coefficient 5 ; degree 2 D. Not a monomial
Solve the problem.Money magazine reports that the percentage of trading days in which the Dasdaq loses or gains 2% or more has been increasing since 1995 indicating more volatility in the Dasdaq. Use a graphing utility to fit an exponential function to the data. Predict the percentage of trading days in 2001 having such swings in value.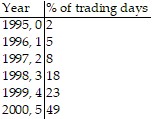
A. y = 2.353e0.610x, 91 days B. y = 1.278e0.611x, 92 days C. y = 1.849e0.531x, 76 days D. y = 1.669x1.706, 46 days
Factor the perfect square trinomial completely.25m2 - 40m + 16
A. (5m + 4)(5m - 4) B. (5m + 4)2 C. (5m - 5)2 D. (5m - 4)2