The above figure shows the Lorenz curve for wealth for the nation of Rusha. The wealthiest forty percent of the population own what percent of wealth?
A) 40 percent
B) 50 percent
C) 60 percent
D) 100 percent
C
You might also like to view...
When income increases, the demand curve for X shifts rightward and the demand curve for Y shifts leftward. These shifts mean that
A) X and Y are complements. B) X and Y both normal goods. C) X is an inferior good and Y is a normal good. D) X is a normal good and Y is an inferior good.
When housing prices fell as they did beginning in 2006 following the housing market bubble, most banks and other lenders ________ the requirement for borrowers, making it ________ for potential home buyers to obtain mortgages
A) tightened; harder B) eased; easier C) eased; harder D) tightened; easier
Consider the production function for bottled water. All of the following would be considered variable inputs except:
A) the plastic bottles. B) the water the bottles are filled with. C) the machine used to fill each bottle. D) the electricity used to power the machine used to fill the bottles.
According the graph shown, the firm's most efficient scale of operation is to produce quantity:
This graph represents the cost and revenue curves of a firm in a perfectly competitive market.
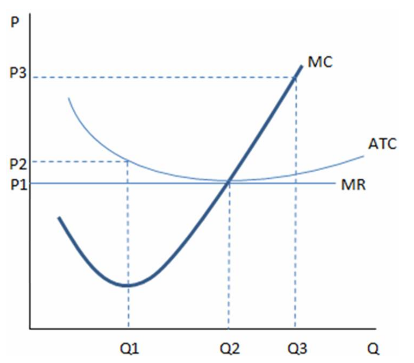
A. Q1.
B. Q2.
C. Q3.
D. Any quantity as long as P1 is charged.