Provide the appropriate response.In a recent city election, 73,457 people voted for Hayes, 67,895 people voted for Mills, 5,698 people voted for Braun, and 452 voted for Simpson. What would be the best way to represent this information?
What will be an ideal response?
Answers will vary. Finding percentages and using a table or circle graph would be good approaches.
Mathematics
You might also like to view...
Tell which integer corresponds to the situation.$130 loss
A. 130 B. -130
Mathematics
Provide an appropriate response.Identify the intercepts from the graph below.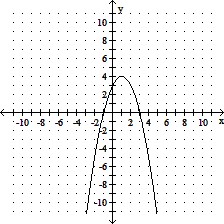
A. (0, -1), (0, 3), (3, 0) B. (-1, 0), (0, 3), (3, 0) C. (0, -1), (3, 0), (0, 3) D. (-1, 0), (0, 3), (0, 3)
Mathematics
Add and simplify. +
+ 
A.
 ? ? |
B.

C.

D.

Mathematics
Give the equations of any asymptotes of the type specified for the graph of the rational function.f(x) =  ; vertical
A. x = 3, x = -3 B. x = 2 C. x = -2 D. None
Mathematics