Use the graph of the function f, plotted with a solid line, to sketch the graph of the given function g.g(x) = f(x + 2) + 1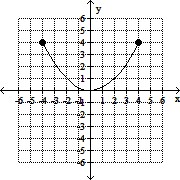

A. 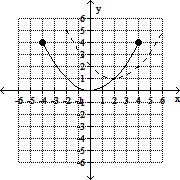
B. 
C. 
D. 
Answer: C
You might also like to view...
State the number of significant digits and the implied precision of the given number.26,000
A. 2 significant digits, precise to the nearest 1000 B. 2 significant digits, precise to the nearest 10,000 C. 5 significant digits, precise to the nearest 1000 D. 5 significant digits, precise to the nearest unit
Divide and simplify. Write the answer as a whole or mixed number when necessary.42 ÷ 
A. 17
B. 18
C. 19
D. 16
Solve the problem.The following table shows the population (in thousands) of Anytown, USA. YEAR POPULATION 1950 80 1960 95 1970 115 1980 150 1990 200 2000 265Use a graphing calculator to fit a quadratic function f(x) to the data. Use this equation to predict the population in the year 2007. Round your answer to the nearest thousand.
A. 316,000 B. 267,000 C. 345,000 D. 16,820,000
Solve the equation by the method of your choice. Simplify irrational solutions, if possible.2x2 + 12x = - 3
A. 
B. 
C. 
D. 