Make a line graph of the data in the table.The following table shows the number of computer sales made at Computer Buy over five months. Use time on the horizontal scale for your line graph.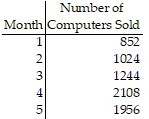
What will be an ideal response?
Answers may vary. A possible answer follows.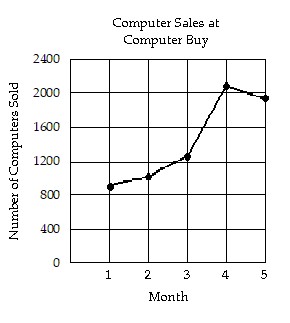
You might also like to view...
Solve the problem.If the length, width, and height of a rectangular solid are measured to be 9, 8, and 3 inches respectively and each measurement is accurate to within 0.1 inch, estimate the maximum possible error in computing the volume of the solid.
A. 1230.00 B. 1025.00 C. 1366.67 D. 1537.50
Provide an appropriate response.How do you find Dz when solving a system of equations using Cramer's Rule?
A. Replace the x-column and y-column values with the constant-column values. B. Replace the z-column values with the constant-column values. C. Replace the x-column values with the constant-column values. D. Replace the y-column values with the constant-column values.
Graph the function.f(x) =  x + 2
x + 2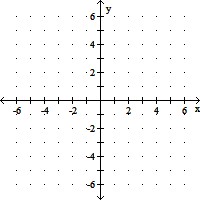
A. 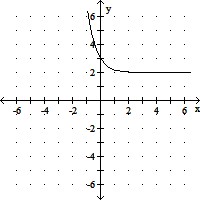
B. 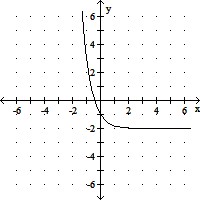
C. 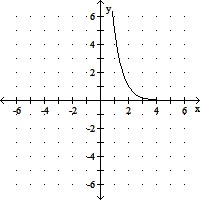
D. 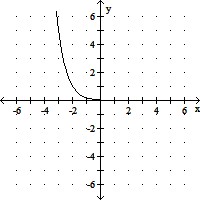
Find the LCD for the rational expression. ,
, 
A. (x - 2)(x - 6) B. (x - 3)(x - 2) C. (x + 3)(x + 2)(x - 6) D. (x - 3)(x - 2)(x - 6)