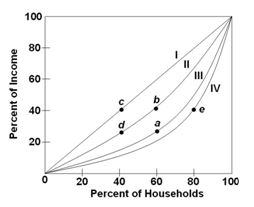
Refer to the figure below, which shows four different Lorenz curves (I, II, III, and IV). What point indicates that the lower 60 percent of the households receive only 40 percent of the nation's total income?
A. a
B. b
C. c
D. d
B. b
You might also like to view...
Rational expectations are the theory according to which people optimally use all the information they have, including information about government policies, when forecasting the future.
Answer the following statement true (T) or false (F)
A key difference between tariffs and quotas is that
A) consumers are hurt with quotas but not with tariffs. B) consumers are hurt with tariffs but not with quotas. C) the government receives revenue with tariffs, but the importer receives added profit with quotas. D) the government receives revenue with quotas, but the importer receives added profit with tariffs.
Opportunity cost is defined as
A) the highest valued alternative that must be given up to engage in an activity. B) the benefit of an activity. C) the total value of all alternatives that must be given up to engage in an activity. D) the monetary expense associated with an activity.
Along a production possibilities curve that is concave to the origin, the opportunity cost of production of the good on the horizontal axis ____ as we move down along the curve
a. Decreases b. Increases c. remains constant d. first decreases, then increases