Use the graph to answer the question.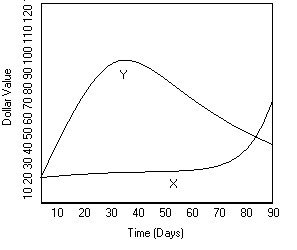 Mike decides to buy shares of companies X and Y, which were initially selling for the same price. The changes in each stock's value over 90 days are shown in the graph above. When did the two stocks have the same value, other than when he bought them?
A. day 90
B. day 80
C. day 85
D. day 50
Answer: C
Mathematics
You might also like to view...
Express the ratio in simplest form.2 and  days to 4 weeks
A. 
B. 
C. 
D. 
Mathematics
Solve the problem.Find the missing measurement in the figure below.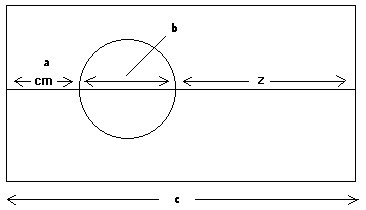 a = 0.76 b = 0.4 cm c = 4 cm
A. z = 3.64 cm B. z = 4.36 cm C. z = 2.84 cm D. z = 3.24 cm
Mathematics
Solve. Write the fractions in simplest form.A real estate agent categorized 100 available homes by housing style.  What fraction of available homes are one and one-half story homes?
A. 
B. 
C. 
D. 
Mathematics
Add or subtract as indicated. Simplify if necessary. +
+ 
A. 
B. 
C. 
D. 
Mathematics