Draw a graph showing the effect on the market of the imposition of a quantity restriction. Show the effect on consumer and producer surplus.
What will be an ideal response?
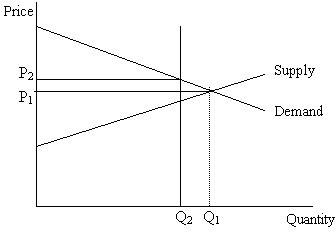
As shown in the graph, the market is originally in equilibrium at a price of P1 and a quantity of Q1. The imposition of the quantity restriction at Q2, which is less than Q1, also has the effect of causing the price to rise to P2. The triangle whose sides are the vertical line at Q2, the supply curve, and the demand curve represents the combined loss in consumer and producer surplus that results.
You might also like to view...
What is the relationship between the marginal product of labor and the value of the marginal product of labor?
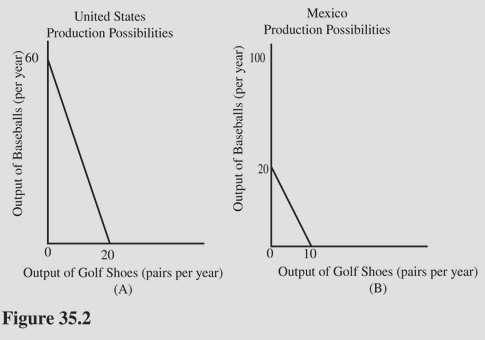 Based on the comparative cost ratios implied in Figure 35.2, it is clear that
A. The United States has a comparative advantage in baseballs and Mexico has a comparative advantage in golf shoes. B. The United States should specialize in producing golf shoes, and Mexico should specialize in producing baseballs. C. The United States should import all of its baseballs from Mexico. D. Mexico should import all of its golf shoes from the United States.
________ countries have explicit requirements about the number of parties that can participate in an election.
A. Most B. None C. All D. Few
The best estimate of the effect of the euro on trade, according to Richard Baldwin, is a(n):
A) increase of 9%. B) increase of 235%. C) fall of 9%. D) fall of 7%.