The bar graph shows the number of students who flunk Dr. Jones' class each year. 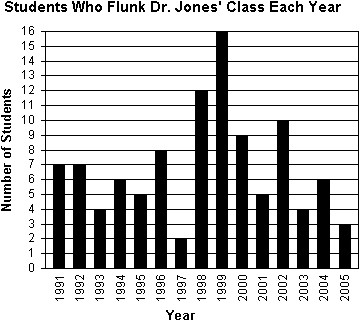 During which year did Dr. Jones' have the greatest number of students flunk his class? How many students flunked during that year?
A. 1999, 16 students
B. 1998, 16 students
C. 1998, 12 students
D. 1997, 2 students
Answer: A
You might also like to view...
Use a calculator to find the approximate value of the expression rounded to two decimal places.cot 0.1859
A. 1.02 B. 5.32 C. 0.19 D. 0.98
Suppose the average waiting time for a customer's call to be answered by a company representative (modeled by exponentially decreasing probability density functions) is 10 minutes. Find the median waiting time. Select the correct answer.
a. 10.93 minutes b. 7.93 minutes c. 6.93 minutes d. 9.93 minutes e. 8.93 minutes
Use the function  to find and simplify the expression for
  .
.
A. 
B. 
C. 
D. 
E. 
Use a graphing calculator to find the y-intercept(s).y = x2 + 7
A. y-intercept (0, 0) B. y-intercept (7, 0) C. y-intercept (0, 7) D. No y-intercept