The following is the slope of line representing annual sale y in term of time x in year. Use the slope to interpret any change in annual sales for a one-year increase in time.
?
The line has a slope of m = -20.
?
A. Sales increasing 20 units/yr
B. Sales decreasing 20 units/yr
C. No change in sales
D. None of the above
Answer: B
You might also like to view...
Find the product.(-2m4z4)(5m3z2)
A. -10mz6 B. -10m6z7 C. -10m7z6 D. -10mz7
Solve the problem.The bar graph shows the number of fatal vehicle crashes per 100 million miles driven for drivers of various age groups. 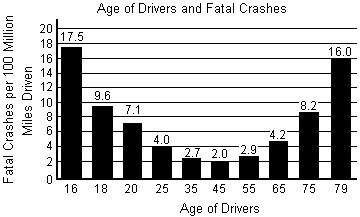 The number of fatal vehicle crashes per 100 million miles, N, for drivers of age x can be modeled by the formula N = 0.012x2 - 1.18x + 31.26.Using the formula, what age group(s) are expected to be involved in 4 fatal crashes per 100 million miles driven? Use a calculator and round to the nearest year. How well does the formula model the trend in the actual data shown in the bar graph?
A. 37 year-olds and 61 year-olds; The formula models the trend in the data reasonably well. B. 27 year-olds and 71 year-olds; The formula does not accurately model the data for ages expected to be involved in 4 fatal crashes per 100 million miles driven. C. 75 year-olds; The formula models the trend in the data reasonably well. D. 24 year-olds ; The formula does not accurately model the data for ages expected to be involved in 4 fatal crashes per 100 million miles driven.
Solve the problem.The range R of a projectile is related to the initial velocity v and projection angle ? by the equation  where g is a constant. How is
  related to
  if ? is constant?
A.  =
= 

B.  =
= 

C.  =
= 

D.  =
= 

Subtract and check.
A. 252,753 B. 252,763 C. 253,753 D. 262,763