You want to create a single chart that shows the proportion of yearly sales for five divisions for each year for five years. Which type of chart can accommodate your needs?
What will be an ideal response?
100% stacked column chart
You might also like to view...
In a different part of the advertisement, you created a bounding box, specifying its dimensions by activating a Type Tool and then clicking on the canvas and dragging. Which category of type are you entering?
a. point b. character c. paragraph d. indexed
Spreadsheet software offers database capabilities for establishing relationships between different record types.
Answer the following statement true (T) or false (F)
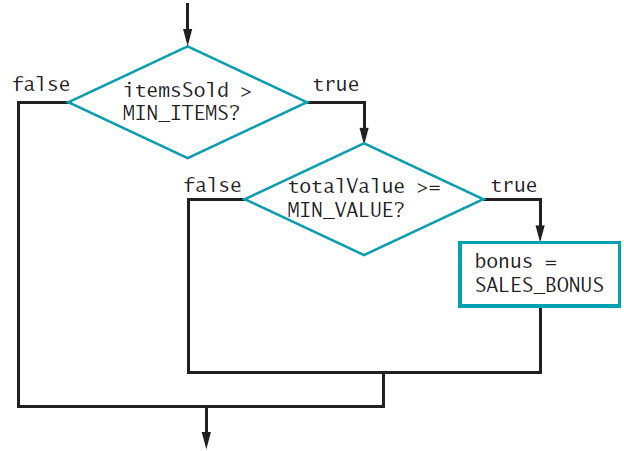 Use the above flowchart to create the code using the logical && operator to determine if a SALES_BONUS will be assigned to the variable bonus.
What will be an ideal response?
To sort data in descending order, follow a sort key with the word ____.
A. REVERSE B. DOWN C. DESC D. TOP