Refer to the accompanying figure. Moving from demand curve D2 to demand curve D1 could be caused by a(n):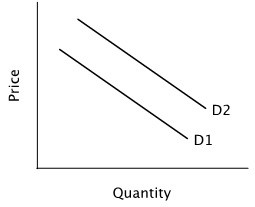
A. increase in the product's expected future price.
B. increase in the price of a substitute.
C. increase in quantity supplied.
D. increase in the price of a complement.
Answer: D
You might also like to view...
In terms of price indexes, what is a COLA?
a. A measure of the quality of living b. A consumer price adjustment c. An increase in wages designed to match consumer price increases d. An estimate of gross domestic product e. A measure of producer surplus
Jobs that require more costly training generally have
a. higher wages b. lower employment levels c. less human capital required d. higher personal risk levels e. lower wages
What determines the magnitude of the changes in price level when central bank takes monetary policy measures that leads to a change in the aggregate demand?
a. Changes in the money supply b. Slope of the aggregate supply curve c. Rate of change of interest rate d. Total money supply in the economy
Two firms, Acme and FirmCo, have access to five production processes, each of which has a different cost and gives off a different amount of pollution. The daily costs of the processes and the corresponding number of tons of smoke emitted are shown in the table below.ProcessABCDE(smoke/day)(4 tons/day)(3 tons/day)(2 tons/day)(1 tons/day)(0 tons/day)Cost to Acme ($/day)$750$800$1,000$1,400$2,000Cost to FirmCo ($/day)$500$750$1,200$2,200$4,000 Suppose the firms are both currently using process A. If the government requires each firm to reduce pollution by 20 percent, then the firms will adopt process ________, and a total of ________ tons of smoke will be emitted each day.
A. B; 16 B. A; 18 C. D; 8 D. C; 12