A certain manufacturing process has a target value of 1.20 cm and a standard deviation of 0.15 cm. A sample of nine measurements is made each hour.Is the process out of control? If so, at what hour does the mean control chart signal go out of control?
Hour
Mean
1

2

3

4

5

6

Hour
Mean
7

8

9

10

11

12

Hour
Mean
13

14

15

16

17

18

Hour
Mean
19

20

21

22

23

24

A. The process is out of control. And, in hour 5, the value was outside the limits.
B. The process is out of control. Ten consecutive points are on one side of the target value line.
C. The process is in control.
D. The process is out of control. Two points are outside the limits.
E. The process is out of control. And, in hour 16, the value was outside the limits.
Answer: E
You might also like to view...
Choose the equivalent expression for the given expression.cos2x
A. 1 - sec2x B. 1 - sin2x C. 1 + sin2x D. sin2x - 1
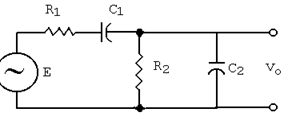
In the circuit shown below, find X.
Find the indicated function value.f(x) = 4x2 - 5, g(x) = 3x2 - 2Find (f + g)(5).
A. 168 B. 22 C. 172 D. 108
Find the derivative of the function.
?

What will be an ideal response?