Refer to Figure 28-7. Consider the Phillips curves depicted in the graph above. The Fed announces its intention to decrease inflation from 10 percent to 5 percent per year, and it succeeds
If the assumptions of the rational expectations school hold true, and the Fed's announcement is credible, the rate of unemployment will be ________ in the short run.
A) less than 5.5 percent B) 5.5 percent
C) between 5.5 and 7.5 percent D) 7.5 percent
B
You might also like to view...
The figure above shows the market for airline tickets. If airline tickets are a normal good, then the recession in 2008 that caused people's incomes to decrease led to a shift from
A) D0 to D1. B) D1 to D0. C) S0 to S1. D) S1 to S0.
Suppose the consumer price index (CPI) for Year X is 130 . This means the average price of goods and services is:
a. currently $130. b. 130 percent more in Year X than in the base year. c. 130 percent more in the base year than in Year X. d. priced at 30 percent more in Year X than in the base year.
Donald Trump’s first years in office could be illustrated by an
A. increase in aggregate demand. B. increase in aggregate supply. C. decrease in aggregate demand. D. decrease in aggregate supply.
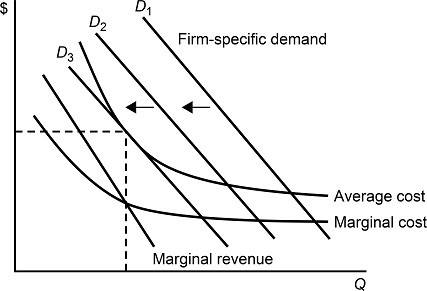 Figure 11.3Figure 11.3 shows demands and costs for a monopolistically competitive firm. When the firm's demand curve shifts from D1 to D2 and to D3:
A. the demand for the firm's product is decreasing. B. the firm's average cost of production is increasing. C. the firm's marginal revenue curve also shifts to the left. D. All of these