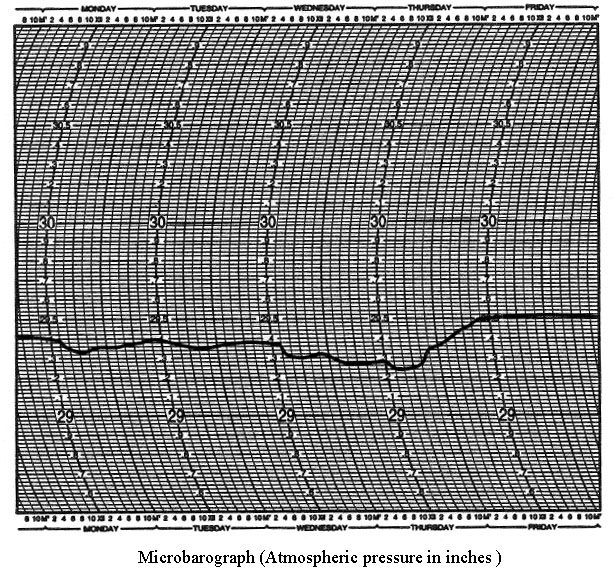
A technician is often asked to read graphs drawn by a machine. The machine records measurements by plotting them on a graph. Any field in which quality control or continuous information is needed might use this way of recording measurements.The figure labeled "Microbarograph (Atmospheric pressure in inches)" shows a microbarograph used by the weather service to record atmospheric pressure in inches. What was the atmospheric pressure recorded for Thursday at 2:00 p.m.?
A. 31.35 in.
B. 30.66 in.
C. 27.63 in.
D. 28.59 in.
E. 29.24 in.
Answer: E
Mathematics
You might also like to view...
Find the derivative of the function.q = 
A. 
B. 
C. 
D. 
Mathematics
Provide an appropriate response.If f(x) = x2 + 2x - 6, find 
Fill in the blank(s) with the appropriate word(s).
Mathematics
Graph the function.f(x) = 5x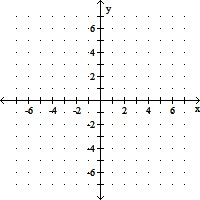
A. 
B. 
C. 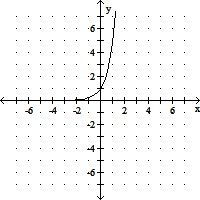
D. 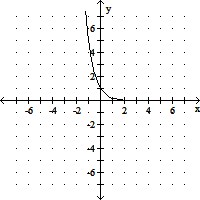
Mathematics
Multiply.(x + 11)(-5x - 6)
A. -5x2 - 61x - 66 B. -5x2 - 63x - 66 C. -5x2 - 66x - 61 D. -5x2 - 61x - 61
Mathematics