A new chocolate company is estimating how many candy bars per week college students will consume of their line of products. The graph shows the probable number of candy bars students (age 18-22) will consume from year 0 to year 10. B(x) gives the number of candy bars for boys, G(x) gives the number of candy bars for girls, and T(x) gives the total number for both groups. Use the graph to answer the question.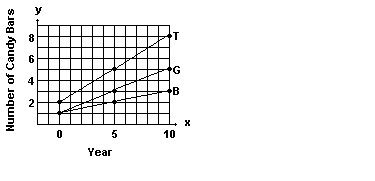 Use the slopes of the line segments to decide in which period (0-5 or 5-10) the number of candy bars per week increased more rapidly.
A. 5-10
B. The number of candy bars increased at the same rate in both periods
C. 0-5
Answer: B
Mathematics
You might also like to view...
Subtract.7.671 - 6.899
A. 14.570 B. 0.872 C. 13.570 D. 0.772
Mathematics
Determine whether the pair of lines is parallel, perpendicular, or neither. 9x + 3y = 1227x + 9y = 38
A. parallel B. perpendicular C. neither
Mathematics
Evaluate the expression.-62
A. -12 B. 12 C. 36 D. -36
Mathematics
Evaluate the arithmetic expression by performing the operations in the appropriate order.7 ? 9 + 8 ? 6 + 4
A. 115 B. 3028 C. 1190 D. 460
Mathematics