Use the following graph for a competitive market to answer the question below.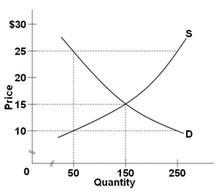 A price floor of $10 per unit will result in a
A. shortage of 200 units.
B. surplus of 200 units.
C. 50 units being traded.
D. No shortage or surplus
Answer: D
You might also like to view...
The trends displayed in the table can best be explained by
A) service industries have increased as a proportion of the economy and they tend to have higher nominal wage rates. B) the inflation rate has been rising over the time period. C) the real wage rate has increased at a rate about equal to the inflation rate. D) the nominal wage rate has increased at a rate about equal to the inflation rate. E) None of the above can explain the trends in the figure.
Suppose a consumer only purchases food and clothing, and food is plotted along the horizontal axis of the consumer's indifference map
If the price of clothing increases and the price of food and income do not change, then the budget line changes by rotating: A) counter-clockwise about the fixed vertical axis intercept. B) clockwise about the fixed vertical axis intercept. C) counter-clockwise about the fixed horizontal axis intercept. D) clockwise about the fixed horizontal axis intercept. E) none of the above
Pure monopoly is not studied because of its descriptive realism, but because it is a stepping stone toward more realistic models.
Answer the following statement true (T) or false (F)
In recent years, Japan, Germany, the UK, and the US have financed most investments
a) from retained earnings b) by borrowing from banks c) by issuing bonds d) by issuing new equity, or shares of stock e) by using trade credit and capital transfers