Solve the problem.In a certain town the annual consumption, b, of beef (in pounds per person) can be estimated by  where t is the number of years since 2010. Find and interpret the t-intercept of the graph of this function.
A. 34; If this trend continues, the annual consumption of beef in this town will be zero pounds per person in the year 2078.
B. 68; The annual consumption of beef in this town was 68 pounds per person in 2010.
C. 34; The annual consumption of beef in this town was zero pounds per person in 2010.
D. 68; If this trend continues, the annual consumption of beef in this town will be zero pounds per person in the year 2078.
Answer: D
You might also like to view...
Choose the equation that matches the graph.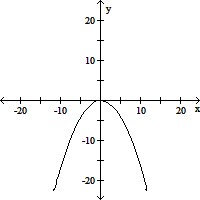
A. x2 = -6y B. y2 = -6x C. x2 = 6y D. -6x2 = y
Solve the problem.To get an A in biology, Fred must average 90 on six quizzes. Scores on the first five quizzes were 95, 87, 88, 95, and 95. What is the lowest score that Fred can get on the last quiz and still receive an A?
A. 91 B. 80 C. 92 D. 90
Use a ratio identity to find tan ? if
?
 and
and  .
.
What will be an ideal response?
Solve the equation for the indicated variable.A = 6s2 for s
A. s = ± 
B. s = ± 
C. s = 36A2
D. s = 