Draw and explain a diagram that illustrates the vicious circle of poverty in DVC.
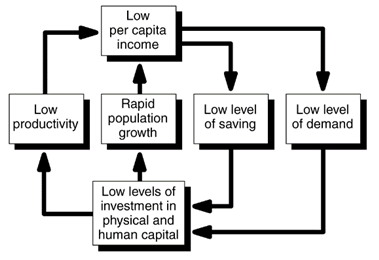
Low per capital incomes make saving and investment difficult in DVC and mean there is a low level of demand. These conditions contribute to low levels of investment in physical and human capital, thus contributing to low labor productivity. The low labor productivity leads to low per capital incomes. Increasing population growth also keeps per capital incomes low. The cycle repeats itself.
You might also like to view...
If a consumer weakly prefers pizza to hot dogs, and weakly prefers hot dogs to chicken, then he ________ pizza ________ chicken
A) likes; less than B) likes; at least as much as C) dislikes; more than D) dislikes; and is indifferent about
Robert Lucas and his followers have argued that the Philips curve appears to be:
a. a vertical line. b. a horizontal line. c. a negatively-sloped curve. d. a positively-sloped curve.
The unemployment rate equals the
a. number of employed persons divided by the number of unemployed persons. b. number of unemployed persons divided by the civilian non-institutional population. c. number of unemployed persons divided by the civilian labor force. d. sum of unemployed persons and discouraged workers divided by the civilian labor force.
Complete crowding out implies that as government increases purchases by $1,
A) private spending decreases by $1. B) Real GDP remains unchanged. C) there is an equal offsetting decrease in one or more of the components of private expenditures. D) all of the above E) none of the above