Refer to the following graph. A decrease in supply is reflected as
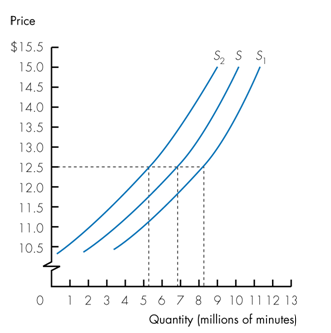
a. a shift of the supply curve from S to S2.
b. a shift of the supply curve from S to S1.
c. a shift of the supply curve from S2 to S1.
d. a change in the quantity supplied from 5.2 to 8.2 million minutes when price is $12.50.
a. a shift of the supply curve from S to S2.
You might also like to view...
Refer to Figure 14.1. Other things equal, if the U.S. dollar increases in value relative to other currencies, this is best represented as a movement from
A) point X to point Y. B) point X to point Z. C) point Y to point Z. D) point Y to point X.
Suppose the price of one euro is fixed at $1.00. A Dutch oil company discovers new oil reserves in the North Sea and offers the oil for sale. If a flexible system is allowed, then what is the impact on the foreign exchange rate?
a. A dollar becomes worth one euro. b. The euro depreciates relative to the dollar. c. A dollar becomes worth two euros. d. The euro appreciates relative to the dollar.
Exhibit 20-3 Money market demand and supply curves
?
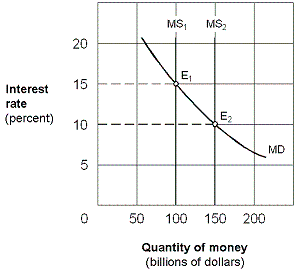 As shown in Exhibit 20-3, assume the money supply curve shifts rightward from MS1 to MS2 and the economy is operating along the intermediate segment of the aggregate supply curve. The result will be a:
A. higher investment, lower real GDP, and lower price level. B. lower investment, lower real GDP, and lower price level. C. higher investment, higher real GDP, and higher price level. D. higher interest rate and no effect on real GDP or the price level.
Suppose that people want bike paths through town, but no private individual or business is willing to build it. This is an example of:
A. productive inefficiency. B. government failure. C. negative externalities. D. market failure.