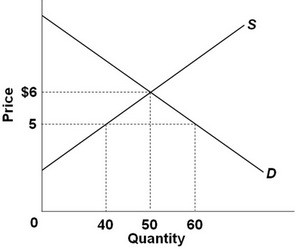
 Refer to the graph above. Over the $5-$6 range, supply is:
A. elastic.
B. one.
C. zero.
D. inelastic.
Answer: A
You might also like to view...
Use the figure below to answer the following question.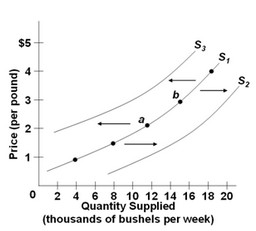 The diagram shows three supply curves for apples today. Which of the following would cause the current supply of apples to shift from S1 to S3?
A. an increase in the number of corn farmers B. expectations of lower apple prices in the future C. a decrease in the price of apples in the market D. expectations of higher apple prices in the future
Which of the following would result in an increase in the demand for Toyota automobiles?
A. An increase in the price of Toyota automobiles B. A decrease in the price of Toyota automobiles C. A decrease in the price of Honda automobiles D. An increase in the price of Honda automobiles
Despite an expansionary monetary policy, an economy experiences a recession. Everything else held constant, the recession could occur in spite of the rightward shift of the LM curve if
A) consumer confidence decreases sharply. B) there is an investment boom. C) the money supply increases. D) taxes are cut.
The NBER's Business Cycle Dating Committee picks recession dates by looking at many variables, the four most important of which are industrial production, manufacturing and trade sales, nonfarm employment, and real personal income
These variables are known as A) leading indicators. B) coincident indicators. C) lagging indicators. D) recession indicators.