In the diagram, curves 1, 2, and 3 represent the:
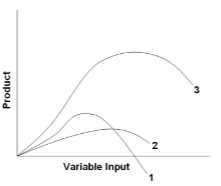
A. average, marginal, and total product curves respectively.
B. marginal, average, and total product curves respectively.
C. total, average, and marginal product curves respectively.
D. total, marginal, and average product curves respectively.
B. marginal, average, and total product curves respectively.
You might also like to view...
Refer to Table 4-4. If a minimum wage of $10.00 an hour is mandated, what is the quantity of labor demanded?
A) 390,000 B) 370,000 C) 350,000 D) 40,000
Other things being equal, the effects of an increase in the price of orange juice would best be represented by a(n):
a. upward movement along the demand curve for orange juice. b. leftward shift in the demand curve for orange juice. c. downward movement along the demand curve for orange juice. d. rightward shift in the demand curve for orange juice.
In any year, nominal GDP divided by the GDP chain price index equals real GDP
a. True b. False Indicate whether the statement is true or false
Domestic producers require time to gain experience and lower their unit costs; this will allow these producers to compete successfully in international markets. This statement describes the ________ argument for protectionism
A) diseconomies of scale B) protecting national security C) anti-dumping D) infant industry