Solve the problem.The following data represents the average monthly minimum temperature for a certain city in California.  Draw a scatter diagram of the data for one period. Find a sinusoidal function of the form
  that fits the data. Draw the sinusoidal function on the scatter diagram. Use a graphing utility to find the sinusoidal function of best fit. Draw the sinusoidal function of best fit on the scatter diagram.
What will be an ideal response?
y = 8.33 sin (0.50x - 2.06) + 57.97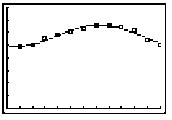
Mathematics
You might also like to view...
Evaluate the integral.
A. ln + C
+ C
B. -5 ln + C
+ C
C. - 2 ln + C
+ C
D. -  ln
ln + C
+ C
Mathematics
Decide whether or not the set of ordered pairs defines a function.{(2, 4), (2, 7), (4, 4), (8, -3), (10, 5)}
A. Yes B. No
Mathematics
Graph the function.g(x) = log5x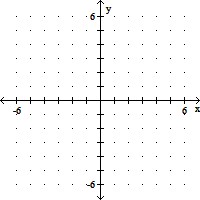
A. 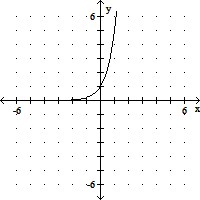
B. 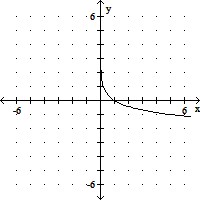
C. 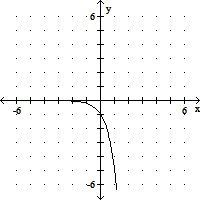
D. 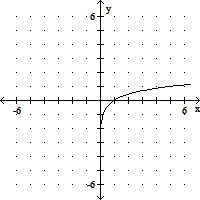
Mathematics
Simplify. ÷ 8 ? (42 ÷
  )
)
A. 56
B. 
C. 
D. 24
Mathematics