According to the graph shown, if the government restricts trade, area G represents:
This graph demonstrates the domestic demand and supply for a good, as well as a quota and the world price
for that good.

A. government tax revenues.
B. deadweight loss.
C. quota rents.
D. transferred surplus.
C. quota rents.
You might also like to view...
Money functions as a(n)
A) medium of exchange. B) unit of account. C) store of value. D) all of the above.
A new discovery of large volumes of previously unknown deposits of natural gas in Pennsylvania would
A) shift only the short-run aggregate supply curve to the right. B) shift only the long-run aggregate supply curve to the right. C) not affect either the short-run or long-run aggregate supply curves. D) shift the short-run and long-run aggregate supply curves to the right.
Which of the following statements accurately describes the U.S. balance of payments in 2017?
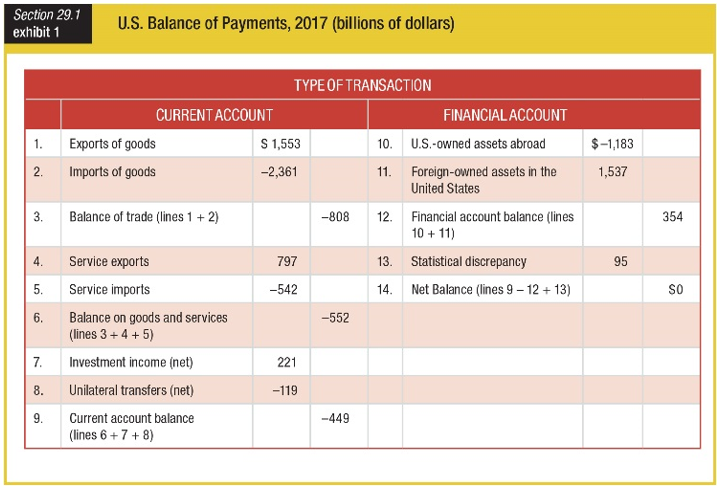
a. The balance on goods and services was a positive value.
b. The balance of trade was a positive value.
c. The balance of services was a positive value.
d. The current account balance was a positive value.
Real estate suitable for condominium development is also suitable for single-family home development. Therefore, a rise in the price of condominiums relative to single-family homes tends to
A) increase the opportunity cost of building new single-family homes.
B) reduce the demand for condominiums.
C) increase the demand for condominiums.
D) do none of the above.