Construct a bar graph to represent the given data.The following table shows the number of female infants born at Hospital X on New Year's Day (Jan. 1).
What will be an ideal response?
Answers may vary. A possible answer follows.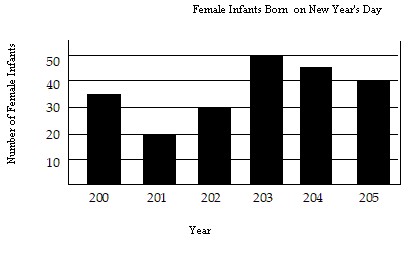
You might also like to view...
Find the GCF of the list of integers.32, 40, 48
A. 4 B. 10 C. 12 D. 8
Solve the problem.Your company uses the quadratic model y = -4.5x2 + 150x to represent the average number of new customers who will be signed on (x) weeks after the release of your new service. How many new customers can you expect to gain in week 14?
A. 168 customers B. 609 customers C. 2037 customers D. 1218 customers
Write an equation for a function that has a graph with the given characteristics.The shape of y = x3 is shifted 3.9 units to the right and then vertically shrunk by a factor of 0.3.
A. f(x) = 0.3(x + 3.9)3 B. f(x) = 0.3(x - 3.9)3 C. f(x) = 3.9(x - 0.3)3 D. f(x) = 0.3x3 + 3.9
Find the indicated sum.
A. 18 B. 14 C. 20 D. 30