Refer to the graph shown. The graph exhibits economies of scale: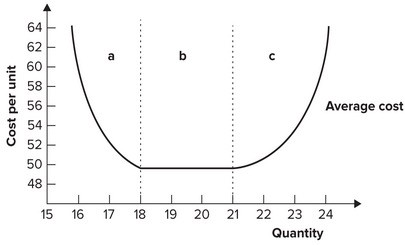
A. in region a.
B. in region b.
C. over the entire range of output.
D. in region c.
Answer: A
You might also like to view...
A monopolist's demand function is P = 1624 - 4Q, and its total cost function is
TC = 22,000 + 24Q -4Q2 + 1/3 Q3, where Q is output produced and sold. a. At what level of output and sales (Q) and price (P) will total profits be maximized? b. At what level of output and sales (Q) and price (P) will total revenue be maximized? c. At what price (P) should the monopolist shut down?
Despite the monetary expansion of the 1992–2000 period, the inflation rate
A. rose due to adverse supply shocks. B. rose due to large increases in aggregate demand. C. fell despite adverse supply shocks. D. fell due to favorable supply shocks.
This table shows the total costs for various levels of output for a firm operating in a perfectly competitive market.PriceQuantityTC$500$10.00$501$20.00$502$27.50$503$77.50$504$147.50$505$250.00According to the table shown, what is the firm's marginal cost from producing the 2nd unit?
A. $20.00 B. $10.00 C. $7.50 D. $27.50
The optimal mix of output is the most desirable combination of output attainable with existing
A. Technology and business decisions. B. Resources, technology, and social values. C. Resources and products. D. Resources, government regulations, and technology.