Plot and interpret the appropriate scatter diagram.The one-day temperatures for 12 world cities along with their latitudes are shown in the table below. Make a scatter diagram for the data. Describe what happens to the one-day temperatures as the latitude increases.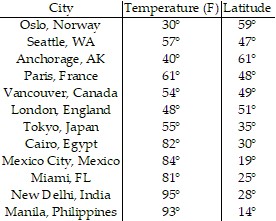 Latitude (degrees)
 Temperature (F)°
What will be an ideal response?
Latitude (degrees)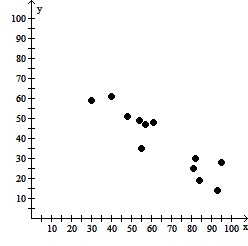
Temperature (F)°
As the latitude increases, the one-day temperatures decrease.
Mathematics
You might also like to view...
Solve the problem.Find the perimeter of the triangle.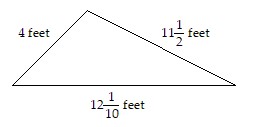
A. 27 feet
feet
B. 27 feet
feet
C. 45 feet
feet
D. 27 feet
feet
Mathematics
Evaluate the expression.(-2)0
A. 0 B. 1 C. -2 D. -1
Mathematics
Solve the indicated equation analytically.The output voltage for an AC generator is approximated by  Find the smallest positive value of t for which the output is 149 volts.
A. t = 0.0082 B. t = 0.0036 C. t = 0.0026 D. t = 0.0072
Mathematics
Find the point-slope form of the equation of the line satisfying the given conditions and use this to write the slope-intercept form of the equation.Slope = 8, passing through (-9, 7)
A. y =  x +
x + 
B. y = 8x - 79
C. y = 8x + 79
D. y = - 8x - 79
Mathematics