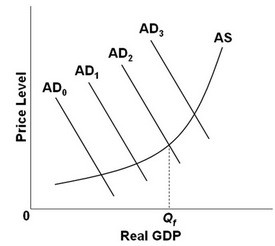
 Refer to the above diagram, in which Qf is the full-employment output. If the economy's current aggregate demand curve is AD0, it is experiencing:
A. a negative GDP gap.
B. a positive GDP gap.
C. inflation.
D. an adverse supply shock.
Answer: A
You might also like to view...
The price elasticity of demand for an agricultural product is 0.4. This value means that, when the quantity decreases 1 percent, the price
A) falls 4 percent. B) rises 4 percent. C) falls 2.5 percent. D) rises 2.5 percent. E) rises 0.25 percent.
The table below shows data for Brazil
2006 2007 Real GDP growth rate 3.8 5.4 Inflation rate 4.2 3.7 Assuming the rate of velocity change is constant A) the growth rate of money increased between 2006 and 2007. B) the money growth rate was -0.4 percent in 2006. C) the growth rate of nominal GDP was 1.7 percent in 2006. D) the demand for money curve shifted leftward in 2006.
Federal Reserve Chairman Volcker's policy to fight inflation
A) led to the 1981-1983 recession, but was ultimately successful. B) led to the 1981-1983 recession, but did not end high inflation due to beggar-thy-neighbor effects. C) was perfectly complemented by Reagan's decrease in fiscal spending. D) led to the 1981-1983 recession and foretold the economic downturn in the mid-1990s. E) led to an immediate depreciation of the dollar.
An increase in the desired stock of housing would be caused by ________
A) an increase in household formation B) higher residential consumption C) a decrease in expected future income D) an increase in home prices