Use algebraic and/or graphical methods to solve the inequality. > 0
> 0
A. x > - 
B. x > 0
C. x < 
D. x < - 
Answer: A
You might also like to view...
Use the vertical line test to determine if the graph is a function.
A. Yes B. No
Find the extreme values of the function subject to the given constraint.

A. Minimum: 5 at (±1, 0); maximum: 0 at (0, 0) B. Minimum: 5 at (0, ±1); maximum: 6 at (±1, 0) C. Minimum: 5 at (0, ±1); maximum: 0 at (0, 0) D. Minimum: 5 at (±1, 0); maximum: 6 at (0, ±1)
Provide an appropriate response.
Using the frequency distribution table for the given ages of students (42, 18, 19, 20, 23, 36, 18, 25, 20, 20, 24, 22, 26, 29, 37, 20, 20, 27, 42, 51, 24, 45, 24, 18, 31) in a technical mathematics class, which age interval has the most students?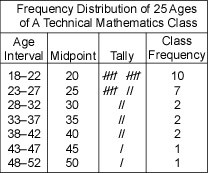
A. 20 B. 24 C. 18-22 D. 18-27
Write as a single logarithm.6 logb y + 8 logb z
A. 14 logb yz B. logb (yz)14 C. 48 logb yz D. logb y6z8